Investor intelligence

Real estate news & insights.

Weekly digest of Canadian real estate news for investors. Interest rates, policy changes, cross-border trends, and actionable takeaways — built around what mattered this week and why it matters.

Canadian markets US markets Rate updates Cross-border

Current indicators

2.25%
Bank of Canada
Policy Rate
6.5%
Canada Unemployment
Rate (September 2026)
3.0%
Canada Inflation Rate
(August 2026, CPI YoY)
4.34%
Best 5-Year Fixed
Mortgage Rate (Broker)

The dispatch

October 2026

The Bank of Canada's Senior Deputy Governor used the month's first afternoon to call housing affordability a trap: higher prices squeeze household budgets, lower prices drain wealth and slow construction, and Carolyn Rogers offered no fix for either. October…

9 reports Every story opens to its full report and sources

Toronto's waterfront condominium towers seen across Lake Ontario

Market Data Story of the month

Permits Rose, Shovels Fell Eleven Percent, and Home Sales Stepped Back

Why it matters: Two Canadian housing releases landed on the same morning on Friday October 16, and they describe the same market from its two opposite ends.

Read the full report

Two Canadian housing releases landed on the same morning on Friday October 16, and they describe the same market from its two opposite ends. The Canadian Real Estate Association published its September resale package from Ottawa at 5 a.m. Eastern, and the Canada Mortgage and Housing Corporation published September housing starts from Ottawa at 8:15 Eastern. Construction slowed and demand pulled back in the same month, and both institutions name the same cause. Start with the shovels. Actual monthly housing starts in centres with a population of 10,000 or more were down 11% year-over-year, with 19,984 units recorded in September 2026 against 22,375 units in September 2025. The year-to-date total for those centres was 170,964 units from January to September 2026, down 4% from the same period in 2025. The total monthly seasonally adjusted annual rate of starts for all areas in Canada was 248,896 units in September, up 3% from August's 242,223. CMHC describes the six-month trend as virtually flat, with what its release calls a slight increase of 0.6 to 250,411 units; the release states that figure without a unit, and the trend measure is itself a six-month moving average of the seasonally adjusted annual rate of total starts for all areas. The rural starts monthly seasonally adjusted annual rate estimate was 18,094 units. Hold that 11% against what this page recorded on Wednesday. Statistics Canada's August building permits, published October 14, showed the total value of permits issued across Canada rising 8.8% to $13.6 billion, with the entire national increase sitting in multi-unit buildings. A permit is a municipality authorizing construction and a start is ground actually being broken, so the two can point in opposite directions. Note that the months differ by one: the permits figure is August and the starts figure is September, so this is a sequence rather than a contradiction inside a single month. The bridge between the two sits in CMHC's own table, and it is the number worth carrying out of this release. The count of units with approved building permits that had not yet been started rose 1.1% month-over-month to 143,929 units in September, in centres of 50,000 or more. That is the stock of authorized-but-unbuilt housing, and it grew. Authorizations are accumulating faster than shovels are following them. The number of units under construction in those same centres was flat month-over-month at 371,617 units against August's 371,658, and completions fell 0.9% to 17,398 units. Among the three biggest census metropolitan areas the six-month trend moved three different ways. Montreal posted an 8% month-to-month decrease driven by lower multi-unit starts, Vancouver recorded a 6% increase on higher multi-unit starts, and Toronto was flat, with the trends for single-detached and multi-unit starts offsetting each other. CMHC's own reading of this is a warning rather than a status report. A key risk for Canada now is not building enough during this period of softening housing markets across the country, said Aled ab Iorwerth, the corporation's Deputy Chief Economist, pointing to its latest Housing Supply Report. He noted that of Canada's four most populous provinces only Quebec has seen modest gains in housing starts for 2026, that each of the seven major centres covered in that report is behind 2025's pace for new home construction, and that unless housing construction levels increase, improvements in housing affordability since 2023 will be difficult to sustain. Now the demand side. The number of home sales recorded over Canadian MLS Systems fell 2.3% month-over-month in September 2026, and actual, not seasonally adjusted, monthly activity came in 7.7% below September 2025. Newly listed properties fell 1.8% month-over-month, which the association frames as new supply resuming a decline that has generally been under way since early 2025. Because the fall in sales only just outpaced the fall in new supply, the national sales-to-new-listings ratio eased to 48.8% from 49.1% in August, against a long-term average of 54.7% and a 45% to 65% band the association treats as consistent with balanced conditions. Inventory did nothing dramatic. Slightly more than 200,000 properties were listed for sale on all Canadian MLS Systems at the end of September 2026, up 1.8% from the same time last year and a little above the long-term average, and the association states that overall supply has held steady at historical average levels since spring 2025. There were 4.9 months of inventory on a national basis at the end of September, up slightly from the summer and in line with the long-term average for that measure. The association puts a seller's market below 3.6 months and a buyer's market above 6.4 months, so 4.9 sits between the two. The price line is where September turned, and one figure in it is a first. The National Composite MLS Home Price Index edged down 0.4% from August to September, a monthly decline arriving after four months of stable prices, which the association attributes to a fresh step down in Ontario where demand softened, alongside the ongoing moderation of offsetting price gains on the Prairies, in Quebec and on the East Coast. On a non-seasonally-adjusted basis that index was down 3.4% compared with September 2025, and the association states that this marked the first time the year-over-year decline had grown larger since January. A shrinking annual decline describes a market finding a floor; an annual decline that widens for the first time since January does not. The non-seasonally-adjusted national average home price was $666,538 in September 2026, down 1.6% from the same month last year. The reason both institutions give is the same one, and it is the development this page should flag plainly. After a four-month run of modestly positive progress on demand, supply and prices, many of Canada's housing markets took a step back in September, said Shaun Cathcart, the association's Senior Economist, who called that hardly surprising given the latest jump in fixed mortgage rates and said the Bank of Canada was now widely expected to follow with a rate hike before the end of the year. He added that with housing affordability already stretched, the question going forward is how much farther the Bank will have to go to keep a lid on inflation next year, and that until that becomes clearer this fresh round of uncertainty will likely send some buyers back to the sidelines. A second commercial source said much the same thing on the same morning from a different direction: the commentary above Ratehub's five-year fixed comparison table, read on Friday October 16, attributed continued pressure on fixed rates to Government of Canada bond yields staying elevated and said that rising energy prices and inflation concerns were increasing the chances of a Bank of Canada rate hike later this month. Both of those are characterizations by commercial parties and neither speaks for the Bank. What this page can state about the Bank itself is narrower. Its policy rate was 2.25% through this window, which is the figure the indicators strip above carries, and its next scheduled interest rate announcement, with a Monetary Policy Report, is Wednesday October 28 at 09:45 Eastern, read off the Bank's own upcoming-events page on Friday October 16. It matters which borrower is being talked about, because the two rates are not the same lever: the overnight rate prices variable mortgages, while the five-year Government of Canada bond yield prices fixed ones. That benchmark yield had not moved across this window, closing at 3.55% on Wednesday October 14, the newest observation posted when the Bank's series was read on Friday October 16. The association's chair put the buyer's side of it. While that makes the task harder for prospective home buyers as it relates to a mortgage, it will also likely mean more homes to choose from and more negotiating power, said Garry Bhaura, adding that for sellers a well thought out pricing strategy becomes more important. One release that was due this morning is not in this entry, and the way it is missing is worth naming. The association's quarterly forecast was due on Friday October 16, a date read off the July release's own closing line, and its quarterly forecasts page, read at 8:50 Eastern, still carried the July 15, 2026 forecast in full. This desk's calendar puts the forecast at 10 a.m. Eastern on forecast months, which is after this entry's read either way; neither that page nor the July release states an hour, so no hour is asserted here as a read. That is a read rather than an assumption, and it carries a trap: the only instance of the string October 16, 2026 anywhere on that page at that read was inside the July release's own closing line stating when the next forecast would be published. A scan of that page for today's date would have matched that forward-looking line and reported a forecast that was not there. The forecast is owed to the next entry. Both releases state their own next dates. The corporation will release October housing starts on November 17 at 8:15 Eastern, and it states that housing starts data is available on the eleventh business day of each month. The next association statistics package will be published on Tuesday November 17, 2026. Decide on your own numbers rather than on the national totals. The Maple Syrup Money mortgage payment, affordability and stress-test, and rent-vs-buy calculators at maplesyrupmoney.com/tools/residential turn a rate into a real monthly payment, and the commercial and investing calculators, cap rate, cash-on-cash, DSCR and the cash flow analyzer, at maplesyrupmoney.com/tools/commercial do the same for income property. Not financial advice. For educational purposes only.

Departments

Rates · Policy · Markets
Canada's Parliament buildings on Parliament Hill, seen across the Ottawa River in autumn

Canada

Seven Weeks of American Increases End While the Cheapest Big-Bank Quote Rises

Rate Watch, week of October 12: this round-up covers the ISO week that began on Monday October 12, and it now covers Monday October 12 through Friday…

Read the full report

Rate Watch, week of October 12: this round-up covers the ISO week that began on Monday October 12, and it now covers Monday October 12 through Friday October 16. It was opened on Tuesday October 13, extended on Thursday October 15 and extended again on Friday October 16. The week-of-October-5 round-up was extended on October 13 to cover Sunday October 11, which closed that week, and nothing here revisits it. Three of these five days carried a release this page scans that has an entry of its own: the National Association of Realtors published September Existing-Home Sales at 10 a.m. Eastern on Tuesday October 13, Statistics Canada published August building permits on Wednesday October 14, and on Friday October 16 the Canada Mortgage and Housing Corporation published September housing starts while the Canadian Real Estate Association published its September resale package, which share the entry above. Thursday October 15 carried Freddie Mac's weekly survey, which is recorded here rather than in an entry of its own. What follows is the rate and calendar record for the five days. Monday October 12 was Thanksgiving Day and a national holiday, and Statistics Canada published no Daily at all. That is a read rather than an assumption: the first lettered release for that date was requested on Tuesday October 13 and returned a 404, which is how a day with no releases presents. Canadian markets were closed that day. Tuesday October 13 carried two releases and neither is a housing document. The first is the Leading indicator of international arrivals to Canada for September 2026 and the second is the Electric Power Selling Price Index for August 2026. The third letter returned a 404, so that day held exactly two. Wednesday October 14 held three releases. The first is Building permits for August 2026, the midweek Canadian housing document and the subject of its own entry here. The second is a study on quality of life among persons with disabilities in Canada and the third a study on access to health care and services among official language minority populations. The fourth letter returned a 404, so the day held exactly three. Thursday October 15 held seven releases and not one of them is a housing document: the Monthly Survey of Manufacturing for August 2026, Wholesale trade for August 2026, a study of disparities in decision and sentencing outcomes between Indigenous and White accused, New motor vehicle sales for August 2026, the Retail Services Price Index for August 2026, the Wholesale Services Price Index for August 2026, and an interactive dashboard on employment by industry in rural Canada for September 2026. Friday October 16 held four releases and none of those is a housing document either: Canada's international transactions in securities for August 2026, Electricity supply and disposition for 2025 on a preliminary basis, Electric power thermal generating station fuel consumption for 2025 on a preliminary basis, and Higher Education Expenditures on Research and Development. The fifth letter returned a 404 on its first request, so the day held exactly four. One reading note on that enumeration, because it is a property of the walk rather than of any one day. The eighth letter for Thursday October 15 returned a 503 on the first request, not a 404. A 503 is a server declining to answer, and it is not the terminator this letter walk depends on, so reading it as the end of the day would have been a guess dressed as a read. It was requested again and returned a 404, and that second read is what makes seven the count for that day rather than a floor. Friday October 16 needed no such second request. Freddie Mac published its weekly mortgage survey on Thursday October 15 at 12 p.m. Eastern, and the number that did not move is the story. The thirty-year fixed-rate average for the week ending October 15 was 7.40%, unchanged from the week ending October 8, and the survey's own commentary leads on that word, reporting that the average thirty-year fixed-rate mortgage remained unchanged for the week. The fifteen-year average was 6.71%, down from 6.73% the week before. A year earlier those two averages were 6.27% and 5.52%, so the thirty-year sat 113 basis points above its year-ago level and the fifteen-year 119 basis points above its own. That rate history file was read again on Friday October 16 and still ended at the week ending October 15, which is expected for a weekly series whose next print falls on Thursday October 22. What ended on that print is a run. Reading the survey's rate history file on Thursday October 15, the thirty-year had risen in seven consecutive weekly prints from the 6.65% of the week ending August 20 - 6.66%, 6.71%, 6.76%, 6.95%, 7.03%, 7.28% and 7.40% - and the week ending October 15 held at 7.40% rather than falling. So the increases stopped and the level did not come down with them. Those two prints at 7.40% were the only two readings of 2026 at or above that figure, and the nearest earlier one anywhere in that file was the 7.44% of the week ending November 16, 2023; the lowest thirty-year print of 2026 had been the 5.98% of the week ending February 26. The fifteen-year's two-basis-point fall is the first decline in that series since the week ending August 20, eight prints earlier, and it followed seven consecutive increases of its own. One methodology note, because it changes what the date on this print means. Freddie Mac states that its results are an average of loan rates offered the prior Thursday through Wednesday, so the week-ending-October-15 figure describes offers made between October 8 and October 14 rather than rates a borrower could have taken on the Thursday it was published. On the Canadian side the benchmark that prices fixed mortgages did not move at all across this window, and one detail of that is worth stating precisely. The Bank of Canada's five-year Government of Canada benchmark series was read twice on Friday October 16, at 8:47 and at 8:49 Eastern, and at both of those reads its newest observation was Wednesday October 14 at 3.55%, with Tuesday October 13 at the same 3.55%. Both sat one basis point above the 3.54% that Friday October 9 had closed at. No observation for Thursday October 15 had been posted at either of those two Friday reads, and no observation for Monday October 12 appeared at all, which the holiday accounts for and which the previous read had already established. Of the nine October sessions posted at those reads, the 3.54% of Friday October 9 had been the lowest and the 3.63% of Monday October 5 the highest. Nothing in that series had changed between the Thursday read and the two Friday ones. The Bank's policy rate was 2.25% through this window, which is the figure the indicators strip above carries. Why that benchmark is the number a Canadian borrower should watch rather than the policy rate: Canadian fixed mortgage rates are priced off Government of Canada bond yields, and only variable rates track the overnight rate. A borrower renewing into a five-year fixed term is exposed to the first number, and a borrower on a variable rate is exposed to the second. The broker table did not move on the Friday, and this read could see further down it than the previous one. Ratehub's comparison table for five-year fixed mortgages, read on Friday October 16, carried its own stamp of October 15, 2026 at 8:13 p.m., so it had been refreshed after the Thursday read rather than left to go stale. Its top five rungs were identical to the Thursday read: 4.34% against an entry listed as a Canadian Lender, 4.59% at Meridian Credit Union, 4.69% against the generic Big 6 Bank entry, 4.69% at Alterna Savings and 4.84% at RBC Royal Bank. So the fifteen-basis-point rise in the cheapest big-bank quote that the Thursday read recorded was not followed by a second move, and the thirty-five-basis-point distance between the leader and the cheapest big-bank quote held. The rungs below the visible five were readable on the Friday and are recorded here for the first time: National Bank of Canada and Tangerine at 4.84%, Equitable Bank, Scotiabank, CMLS Financial and Canwise at 4.89%, First National and CIBC at 4.99%, TD Bank at 5.04%, MCAP at 5.09%, Bank of Montreal at 5.19% and ICICI Bank Canada at 5.99%. One reading note on that page, because a fifth entry has now recorded it and the gap has widened again. The written commentary above the table still said that as of September 8, 2026 Scotiabank offered the lowest five-year fixed mortgage rate at 4.29%. On the Friday read Scotiabank's own rung on the table beneath that sentence was 4.89%, sixty basis points above the figure the prose names, and it was the eighth cheapest rung rather than the first. A separate line on the same page, dated October 16, 2026, read 4.34% for the lowest available high-ratio five-year fixed rate and 3.43% for the lowest variable rate, and that line agrees with the table. So the page carried a dated claim that was consistent with its own table and an older prose claim that was not. The table carries a timestamp and the prose does not. Read the table. The closing diff over Friday October 16, by source, in both directions. The Canada Mortgage and Housing Corporation published September housing starts at 8:15 Eastern, which has its own entry above; only the housing-starts-construction-data slug returned a 200, and the older housing-starts slug shape returned a 404 on the same morning, which is the slug-shape note on this desk holding for a fifth month. The Canadian Real Estate Association published its September resale package at 5 a.m. Eastern, also covered above; its quarterly forecast, due the same morning on a date read off the July release's own closing line, had not been published when that page was read at 8:50 Eastern and is owed to the next entry; this desk's calendar puts it at 10 a.m. Eastern but neither page states an hour. Statistics Canada's four Friday releases are enumerated above and none is a housing document, and the September Consumer Price Index remained ahead of this window on Monday October 19. The Bank of Canada's press-release, speeches and publications indexes were all read on Friday October 16, and the newest October-dated item on any of the three was still Thursday October 8, the demographic-change explainer which already has its own October 8 entry here. Freddie Mac's history file is addressed above. The National Association of Realtors' newsroom was read on the Friday and carried no item dated between October 10 and October 19; its September Pending Home Sales Index falls on Tuesday October 20. The Census Bureau had nothing due: September New Residential Construction falls on Tuesday October 20 and September New Residential Sales on Tuesday October 27, and the bureau's economic-indicators page read on the Friday still carried August 2026 construction spending of $2,203.1 billion, up 0.9%, as its newest figure for that product, which this page has already covered. The Federal Reserve's press-release index was read on the Friday by href shape rather than by date text, and its newest item was still the October 13 discount-rate minutes this round-up already named and carried as no finding; nothing was dated October 14 to 16. The Bank of Canada's upcoming-events page is the one source on that list with something to name for the Friday, and it is named here as a pending item rather than as a finding. That page carried two Bank appearances dated October 16, 2026: a panel featuring Governor Tiff Macklem at the International Monetary Fund in Bangkok, Thailand, and a fireside chat featuring External Deputy Governor Michelle Alexopoulos at the Sobey School of Business at Saint Mary's University in Halifax. Neither is a statistical release and no text from either had appeared on the Bank's speeches, press-release or publications indexes at the Friday read, which is why nothing from them is reported here. If remarks from either are published they belong to the next entry. Read the other way, from the hosts this entry cites back to the release calendar this desk keeps, the diff is clean with the two standing exceptions this page has already recorded: Reuters, a continuous wire rather than a scheduled print and never the only source here for a figure a primary publisher states directly, and Ratehub, a comparison table carrying its own update stamp rather than a release on any calendar. The previous read left three items open by name and two of them close here. It recorded that the Canadian Real Estate Association's September resale package and the Canada Mortgage and Housing Corporation's September housing starts were both still ahead of the window; both published on Friday October 16 and share the entry above. It also recorded that Statistics Canada's September Consumer Price Index was set for Monday October 19, read off that agency's own Consumer Price Index Portal, with no hour stated; that release is still ahead of this window, and August 2026 remained the newest published reference month through all five days, which is the vintage the inflation figure in the indicators strip above carries. No Consumer Price Index release appeared in any of the five Dailies this entry enumerated. Ahead of the next entry, in date order, each hour as the source itself states it. The Canadian Real Estate Association's quarterly forecast, which was due on Friday October 16 and had not published at this entry's read, with no hour stated by the association itself. Statistics Canada's September Consumer Price Index on Monday October 19, with no hour read for it. The Bank of Canada's Business Outlook Survey and Canadian Survey of Consumer Expectations on Monday October 19 at 11:30 Eastern, read off the Bank's own upcoming-events page on Friday October 16. New Residential Construction for September from the Census Bureau on Tuesday October 20 at 8:30 Eastern, and the National Association of Realtors' September Pending Home Sales Index on the same day at 10 a.m. Eastern. Freddie Mac's next weekly mortgage survey on Thursday October 22 at 12:00 Eastern. The Federal Housing Finance Agency's monthly House Price Index on Tuesday October 27, read off that agency's own published release-date table and covering data through August 2026, with its release hour still unverified by this desk, and S&P Global's Case-Shiller indices on the same date on a last-Tuesday convention rather than a published rule, with that publisher's hour unverified as well. New Residential Sales for September on Tuesday October 27 at 10:00 Eastern and third-quarter Housing Vacancies and Homeownership on Wednesday October 28 at 10:00 Eastern. The Bank of Canada's interest rate announcement with a Monetary Policy Report on Wednesday October 28 at 09:45 Eastern, read off the Bank's own upcoming-events page on Friday October 16. The association's third-quarter Metro Home Prices on Thursday October 29 at 10 a.m. Eastern. September construction spending on Monday November 2 at 10:00 Eastern. Two labour prints follow on Friday November 6, and they are two obligations on two schedules that happen to coincide this time rather than one shared morning: the Bureau of Labor Statistics' Employment Situation for October at 08:30 Eastern, read off that bureau's own reference-month table, and Statistics Canada's October Labour Force Survey at 08:30 Eastern, read off the September release's own next-release line. On Tuesday November 10 the Bank of Canada publishes its Summary of Deliberations for the October 28 announcement. Statistics Canada's September building permits on Thursday November 12, read off the August release in hand, and the association's October Existing-Home Sales on that same day at 10:00 a.m. Eastern. The Canada Mortgage and Housing Corporation's October housing starts on Tuesday November 17 at 8:15 Eastern and the association's October resale package on that same day, both read off the releases published on Friday October 16. And on Wednesday November 18 at 2:00 p.m. Eastern, the next set of Federal Open Market Committee minutes. Decide on your own numbers rather than on the calendar. The Maple Syrup Money mortgage payment, affordability and stress-test, and rent-vs-buy calculators at maplesyrupmoney.com/tools/residential turn a 4.34% fixed into a real monthly payment, and the commercial and investing calculators, cap rate, cash-on-cash, DSCR and the cash flow analyzer, at maplesyrupmoney.com/tools/commercial do the same for income property. Not financial advice. For educational purposes only.

Sources
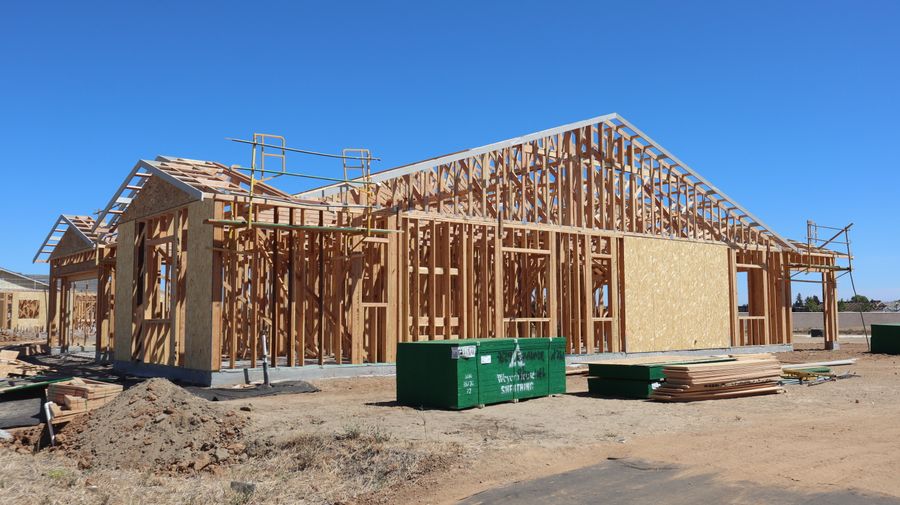
A new single-family home under construction with its wooden roof and wall framing exposed

Canada

Construction Intentions Rebound Nearly Nine Percent, but Single-Family Houses…

Statistics Canada published Building permits for August 2026 on Wednesday October 14, and it is the one Canadian housing release of this window.

Read the full report

Statistics Canada published Building permits for August 2026 on Wednesday October 14, and it is the one Canadian housing release of this window. The total value of permits issued across Canada rose $1.1 billion, or 8.8%, to $13.6 billion. On a constant dollar basis, which strips construction price inflation out and is indexed to 2023, the total grew 8.6% from the previous month and stood 12.4% above the same month a year earlier. The rebound is almost entirely residential, and almost entirely one kind of residential. Residential construction intentions rose $1.1 billion to $8.5 billion, while the non-residential sector was little changed at $5.1 billion, down $29.8 million. Inside the residential figure the multi-unit component rose $1.1 billion to $5.8 billion and the single-family component edged down $0.7 million to $2.6 billion. So the entire national increase sits in apartments, condominiums and other multi-unit buildings, and detached houses did not participate in it at all. The unit counts say the same thing in a different unit of measure. Across Canada 21,800 multi-unit dwellings and 4,000 single-family dwellings were authorized in August, up 12.8% from the previous month. That is roughly five and a half multi-unit dwellings authorized for every single-family one. One figure in this release points the other way from its own headline, and it is the part worth carrying. Over the twelve months from September 2025 to August 2026, the total number of multi-unit and single-family dwellings authorized was 299,500, down from 305,500 in the preceding twelve-month period. A permit is an intention rather than a shovel, and a strong single month sitting inside a weaker trailing year describes volatility rather than a recovery. The revision note matters here too, because this page carries the July figure. When July 2026 permits were published in September, this page recorded the total value falling $2.6 billion, or 17.3%, to $12.2 billion. The August release states that seasonally adjusted data in current dollars were revised for the previous two months, and $13.6 billion less the stated $1.1 billion increase puts the revised July level near $12.5 billion. So July's fall was shallower than it first printed, and the August gain is measured against the revised number rather than against the $12.2 billion. Ontario led the multi-unit gains at $696.0 million, followed by British Columbia at $189.8 million and Alberta at $115.9 million, with seven provinces and two territories contributing to the increase. The single-family decline was led by Alberta at $32.7 million, the Northwest Territories at $10.9 million and Manitoba at $7.9 million. By province, the monthly change was an increase of 26.9% in Manitoba, 21.7% in Alberta, 21.0% in Nova Scotia, 15.9% in Saskatchewan, 9.4% in Ontario, 7.5% in British Columbia and 3.9% in Quebec, and a decrease of 35.6% in New Brunswick, 14.6% in Newfoundland and Labrador and 12.2% in Prince Edward Island. Ontario at $5.1 billion, Quebec at $2.9 billion, British Columbia at $2.1 billion and Alberta at $2.0 billion carry most of the national total between them. The non-residential side moved in two directions at once. The commercial component fell $380.0 million to $2.2 billion, led down by Quebec at $317.4 million and British Columbia at $122.0 million, with Alberta tempering the decline by $95.4 million. That was largely offset by the industrial component, up $317.3 million to $1.1 billion on gains led by Alberta at $169.3 million and Quebec at $134.8 million, and by the institutional component, up $32.9 million to $1.8 billion on Quebec at $188.5 million and British Columbia at $68.3 million, with Ontario tempering that increase by $211.2 million. What this release is not: it is not housing starts. A permit is a municipality authorizing construction and a start is ground actually being broken, and the two can say opposite things about the same month. The Canada Mortgage and Housing Corporation's September housing starts were due on or about Friday October 16 at 8:15 Eastern, after this entry, and that is the figure to read next to this one. Permit data for September 2026 will be released on Thursday November 12, read off this release's own next-release line. Decide on your own numbers rather than on the national totals. The Maple Syrup Money mortgage payment, affordability and stress-test, and rent-vs-buy calculators at maplesyrupmoney.com/tools/residential turn a rate into a real monthly payment, and the commercial and investing calculators, cap rate, cash-on-cash, DSCR and the cash flow analyzer, at maplesyrupmoney.com/tools/commercial do the same for income property. Not financial advice. For educational purposes only.

A red “Home for Sale” sign staked in the front yard of a modern house

United States

Two of the Year's Slowest Months, and Prices Rose for a Thirty-Ninth Time

The National Association of Realtors published its September Existing-Home Sales report on Tuesday October 13 at 10 a.m.

Read the full report

The National Association of Realtors published its September Existing-Home Sales report on Tuesday October 13 at 10 a.m. Eastern, and it is the largest American housing document of this window. Sales rose 1.5% from August to a seasonally adjusted annual rate of 3.99 million, and fell 2.2% from September 2025. The association's chief economist, Lawrence Yun, put the monthly gain in its place in the release itself: August and September were the two slowest months for home sales this year, and the small rise between them does not change that. Month over month, sales rose in the South and the West, held steady in the Midwest and fell in the Northeast. Year over year they fell in all four regions. Supply is the part of this release that moved most. Total housing inventory reached 1.60 million units, up 1.9% from August and 4.6% from a year earlier, and unsold inventory represented a 4.8-month supply, unchanged from August but up from 4.5 months a year ago. The median time on market was 33 days, up from 31 days in August and unchanged from September 2025. Yun's reading of that combination is that higher inventory and longer listing times give buyers more negotiating power, and that sellers need to be realistic about local conditions, which could mean price discounts or other incentives. Prices did not follow supply. The median existing-home price for all housing types was $417,500, up 1.3% from $412,300 a year earlier, which is the thirty-ninth consecutive month of year-over-year price increases. The Housing Affordability Index registered 105.4, down from 106.7 one year ago, and affordability fell year over year in three of the four regions: 4.5% in the Northeast, 3.1% in the Midwest and 0.4% in the South, while the West improved 1.0%. The two property types went opposite ways. Single-family sales rose 2.0% from August to an annual rate of 3.64 million, down 1.9% from September 2025, with a median price of $422,700, up 1.2% year over year. Condominium and co-op sales fell 2.8% from August to an annual rate of 350,000, down 5.4% from a year earlier, with a median price of $363,700, also up 1.2%. By region, the Northeast fell 2.1% from August to an annual rate of 470,000 and 4.1% from a year ago, with the highest median price of the four at $523,600 and the fastest annual price growth at 4.7%. The Midwest was unchanged from August at 930,000, down 2.1% year over year, median $329,600 and up 3.1%. The South rose 2.8% to 1.86 million, down 0.5% year over year, median $361,000 and up only 0.2%. The West rose 2.8% to 730,000, the steepest annual decline of the four at 5.2%, median $613,600, and the only region where the median price fell from a year earlier, by 0.3%. Who is buying changed as well. First-time buyers were 31% of sales, up from 30% in August and 30% a year ago. Cash buyers were 27% of transactions, unchanged from August and down from 30% a year earlier. Individual investors and second-home buyers were 20% of transactions, up sharply from 15% both in August and a year ago. Distressed sales were 2%, unchanged on both comparisons. There is one timing point in this release that matters more than any single figure in it, and the release supplies it. The association reports that Freddie Mac's thirty-year fixed mortgage rate averaged 6.86% across September, up from 6.67% in August and 6.35% a year earlier. Existing-home sales are counted at closing, so September's 3.99 million annual rate reflects contracts signed several weeks before that, at rates lower still. The same weekly survey printed 7.40% for the week ending October 8. So the rate increase Yun names as the reason fewer buyers can qualify is not yet inside these numbers. It arrives in the October and November prints. For a Canadian reader the comparison is a term apart and should not be read as like for like. The lowest advertised five-year fixed rate on the Canadian comparison table, read on Tuesday October 13, was 4.34%, which is 306 basis points under the American thirty-year weekly average for the week ending October 8. But a five-year Canadian term and a thirty-year American one are different products carrying different renewal risk: the Canadian borrower re-prices in five years at whatever rates then are, and the American borrower does not. The gap between the two headline numbers is not a measure of which borrower is better off over the life of the loan. Existing-Home Sales for October 2026 will be released on Thursday November 12, 2026 at 10:00 a.m. Eastern, read off the September release's own next-release line. Decide on your own numbers rather than on the regional averages. The Maple Syrup Money mortgage payment, affordability and stress-test, and rent-vs-buy calculators at maplesyrupmoney.com/tools/residential turn a rate into a real monthly payment. Not financial advice. For educational purposes only.

The Canadian maple-leaf flag flying from a pole against a clear blue sky

Rates

Canada Shed Jobs for a Second Month While American Mortgage Rates Kept Climbing

Rate Watch, week of October 5: this entry opens a fresh round-up for the ISO week that began on Monday October 5, and it covers Monday October 5…

Read the full report

Rate Watch, week of October 5: this entry opens a fresh round-up for the ISO week that began on Monday October 5, and it covers Monday October 5 through Sunday October 11, which is the whole of that week. It was opened on Thursday October 8, extended on Saturday October 10 to cover Friday October 9 and Saturday October 10 itself, and extended again on Tuesday October 13 to cover Sunday October 11 and close the week. The week-of-September-28 round-up closed itself on Sunday October 4 and nothing here revisits it. Three of the first four days passed without a single housing, mortgage or rates figure from any source this page scans. Thursday October 8 carried two of them. Freddie Mac's weekly mortgage survey rose for a seventh consecutive week, to the highest thirty-year fixed average that survey had printed since 2023, and the Federal Open Market Committee published the minutes of its September meeting, a rates document that had been on no schedule this desk works from until Wednesday October 7. Friday October 9 then brought the two largest documents of the week, and only one of them is a housing document. Statistics Canada published the September Labour Force Survey, a labour print rather than a housing one, which recorded a second consecutive monthly decline in employment and is read in the labour paragraph below because it moves the unemployment figure in the indicators strip above. The Federal Reserve Board published the 2025 Survey of Consumer Finances, which is about American homeownership and household debt and has its own October 9 entry on this page rather than a paragraph in this one. Saturday October 10 brought nothing from any source here, and neither did Sunday October 11, the day that closed the ISO week. On the Canadian side one lender raised its advertised five-year fixed rate inside the window and the cheapest big-bank quote on the broker table moved up twenty basis points on a Wednesday-evening refresh, after which the whole ladder sat still through the Friday and the Saturday, while the five-year Government of Canada benchmark gave back ground on the Friday October 2 session, took more than all of it back on the Monday, and finished the sessions that had been posted by the Saturday October 10 read three basis points under that Monday close. Three items the previous entry left open are closed here, by name. First, the Bank of Canada's five-year benchmark close for Friday October 2: that entry recorded that no session had been posted for it when the series was read on the morning of Sunday October 4, said the Bank's ordinary next-morning rhythm would put it up on Monday October 5, and deliberately asserted nothing about what it would carry. It carried 3.60%. Second, that entry left the next Freddie Mac weekly survey ahead of it, on Thursday October 8 at 12:00 Eastern. It printed on that day and the figures are below. Third, that entry flagged the Federal Housing Finance Agency and S&P Global's Case-Shiller indices as cited in this corpus and scheduled nowhere in it. Half of that is closed in this entry and the closing paragraphs below carry it: the agency publishes its House Price Index release dates and they were read on Saturday October 10, so its dates are no longer a convention this desk infers. The Case-Shiller indices remain in the state that entry described. Two further items this round-up itself recorded as pending in its Wednesday-morning pass are closed here as well, which is what that handoff is for. The September minutes of the Federal Open Market Committee, which returned a 404 when the document was requested on the morning of Wednesday October 7, were published that afternoon and are read below. And the five-year Government of Canada benchmark closes for Tuesday October 6 and Wednesday October 7, neither of which had been posted when the series was read twice on the Wednesday morning, were both posted by Thursday October 8: 3.59% and 3.60% respectively. Freddie Mac's Primary Mortgage Market Survey printed a 7.40% 30-year fixed and a 6.73% 15-year fixed for the week ending October 8, read off the survey's own rate history file after it refreshed at 12:00 Eastern on Thursday October 8. The 7.40% thirty-year was up 12 basis points from the 7.28% of the week ending October 1. The 6.73% fifteen-year was up 13 basis points from the 6.60% of that same week. That is a seventh consecutive weekly increase on the thirty-year, counting from the 6.65% of the week ending August 20, and 75 basis points of cumulative increase across those seven weeks. Both averages were the highest the survey had printed since the week ending November 16, 2023, when the thirty-year stood at 7.44% and the fifteen-year at 6.76%. The 7.40% was also the highest thirty-year average of 2026, in a year whose lowest weekly print was the 5.98% of the week ending February 26. On a $400,000 thirty-year fixed mortgage, 7.40% carries a principal and interest payment of $2,769.52 a month, which is $32.67 above the $2,736.85 the previous week's 7.28% carried and $376.46 above the $2,393.06 that February low would have carried. The 4.34% at the top of the Canadian broker table was 306 basis points under the American thirty-year average on the same day, but a five-year Canadian term and a thirty-year American one are different products carrying different renewal risk, and the gap between them is not a measure of which borrower is better off over the life of the loan. The minutes of the September 15 and 16 meeting were published on the afternoon of Wednesday October 7, three weeks after that meeting's decision date of Wednesday September 16, and the document carried a last-update stamp of October 07, 2026. They record that the Committee raised the target range for the federal funds rate by a quarter point to 3-3/4 to 4 percent, that twelve members voted for the action and none against, that the Board of Governors voted unanimously to raise the interest rate paid on reserve balances to 3.90 percent effective September 17, 2026, and that it approved a quarter-point increase in the primary credit rate to 4.0 percent on the same date. Three passages in those minutes are about housing directly, and they are the reason a rates document of this kind belongs on this page. On financing conditions, the minutes record that conditions in domestic credit markets remained generally accommodative for larger businesses and municipalities but were somewhat restrictive for residential mortgage borrowers and small businesses, and that residential mortgage rates increased a bit more than 10-year Treasury yields over the intermeeting period. On the sector itself, a few participants commented that housing was a sector in which financial conditions did not appear supportive of activity, with mortgage rates remaining at elevated levels. And on inflation, several participants observed that the rate of price increases in core services excluding housing remained elevated, which puts the shelter component outside the group of categories those participants singled out as still running hot. The market backdrop the minutes describe is the one a mortgage borrower pays for: nominal Treasury yields increased around 35 basis points across the 2- to 10-year segment of the curve over the intermeeting period, and the minutes attribute part of that to the higher expected path of policy and part to term premiums, including competition for capital from debt issued to finance artificial-intelligence infrastructure. Set against the survey print above, the two documents describe the same thing from opposite ends. Those participants characterised mortgage rates as elevated and as not supportive of housing activity at a meeting that ended on September 16, and the weekly average has risen in every week since: 6.95% for the week ending September 17, 7.03% for the week ending September 24, 7.28% for the week ending October 1 and 7.40% for the week ending October 8. Note what the Committee did rather than only what it said, because the direction is the opposite of the Canadian one. The Federal Open Market Committee raised its target range at that September meeting, while the Bank of Canada has held its overnight rate at 2.25% since September 2. Statistics Canada published seventeen releases across the six days. Not one is a housing, mortgage or rates release, and the one that matters most to this page is a labour release. Monday October 5 carried two, lettered a and b, with c returning a 404: travel arrangement services for 2025, and sawmills for July 2026. Tuesday October 6 carried four, a through d, with e returning a 404: Canadian international merchandise trade for August 2026, Canadian international trade in services for August 2026, violent victimization and unwanted sexual behaviours experienced by 2SLGBTQ+ people in Canada for 2025, and surveying and mapping services for 2025. Wednesday October 7 carried one, with b returning a 404: monthly average retail prices for selected products for August 2026. Thursday October 8 carried four, a through d, with e returning a 404: the economic contribution of critical mineral production in Canada for 2024, the Retail Commodity Survey for July 2026, police-reported hate crime and cybercrime for the second quarter of 2026, and the Farm Input Price Index for the second quarter of 2026. Friday October 9 carried six, a through f, with g returning a 404: the Labour Force Survey for September 2026, annual wholesale trade commodities for 2024, farm product prices for August 2026, film, television and video post-production for 2025, the national supply and disposition of major grains for 2025/2026, and sector-based producer price indexes for the second quarter of 2026. Saturday October 10 carried none: the first letter of the day returned a 404, which is what a Saturday looks like from this agency. That is a quiet six days from the agency on housing rather than six days this desk failed to read, and the letters get walked one at a time precisely so those two can be told apart. The nearest thing in the set to a household-cost figure is the August retail-prices release, and it is not a shelter statistic. The September Labour Force Survey is the Friday release, and it is the one that moves the unemployment figure in the indicators strip above off August 2026. It is read in the next paragraph. Employment fell by 68,000 in September, down 0.3%, and the unemployment rate was 6.5% in September 2026, up 0.1 percentage points on the month. Both figures are read off the Labour Force Survey released on Friday October 9 at 08:30 Eastern, and the 6.5% is what the indicators strip above now carries, with its vintage moved from August 2026 to September 2026. It is the second consecutive monthly decline in employment, following August's fall of 42,000, and the September decline was split almost evenly between full-time work, down 35,000 or 0.2%, and part-time work, down 33,000 or 0.9%. Before those two months employment had trended up from April to July by 181,000, and on a year-over-year basis it was still up by 95,000 in September. The employment rate fell 0.2 percentage points to 60.6%, also a second consecutive monthly decrease. The 6.5% unemployment rate had a recent peak of 6.9% in April before declining to 6.4% in July and August, and the September reading put it back where it had been in January. The losses were concentrated among youth aged 15 to 24, down 48,000 or 1.8%, and women aged 25 to 54, down 28,000 or 0.4%, and by industry in educational services, down 35,000 or 2.2%, health care and social assistance, down 23,000 or 0.8%, and manufacturing, down 13,000 or 0.7%. Public sector employees fell by 70,000 or 1.5%, a fourth consecutive monthly decline, and were down 119,000 or 2.6% year over year, most of it attributable to educational services. By province, employment decreased in Quebec by 49,000 or 1.1%, in British Columbia by 20,000 or 0.7% and in Manitoba by 4,400 or 0.6%, and increased in Alberta by 23,000 or 0.9%. Average hourly wages among employees rose 2.3% year over year, up $0.86 to $37.64, following growth of 2.0% in August, not seasonally adjusted. Why a jobs print sits on a housing page, stated rather than assumed, because this entry otherwise carries no Canadian housing release at all. A lender underwrites employment income, so two consecutive monthly declines and a 2.3% wage increase are the two halves of what a Canadian borrower brings to a renewal priced off a 4.34% five-year fixed. The survey's other finding, the labour force participation rate at 64.8% and its lowest level since December 1997 excluding 2020, is a demographic statement rather than a labour-market one, and the agency says so and shows the arithmetic. That half of the release is read against the Bank of Canada's own demographics explainer of Thursday October 8 in the separate October 8 entry on this page, because the two documents are one story and neither is a rate. The next Labour Force Survey is on Friday November 6, 2026, and October data will reflect labour market conditions during the week of October 11 to 17, both read off this release's own next-release line. The five-year Government of Canada benchmark finished the sessions that had been posted by the Saturday October 10 read three basis points under its Monday close. When the series was re-read on the morning of Saturday October 10 the Bank had posted closes for Monday October 5, Tuesday October 6, Wednesday October 7 and Thursday October 8, and had posted none for Friday October 9. That last absence is this page's ordinary expectation rather than a gap in the series and rather than a claim about what the session carried: the Bank posts a session's close the following morning, Friday's would fall due on Monday October 12, and Monday October 12 is Thanksgiving Day. Nothing here asserts what the Friday October 9 close was or when it will appear. Taking the Friday before the window as the starting point, and naming the series in each sentence rather than carrying it forward as a pronoun: the five-year Government of Canada benchmark closed at 3.60% on Friday October 2, two basis points under the 3.62% of Thursday October 1. The five-year Government of Canada benchmark closed at 3.63% on Monday October 5, three basis points above that Friday close. The five-year Government of Canada benchmark closed at 3.59% on Tuesday October 6, four basis points under the Monday. The five-year Government of Canada benchmark closed at 3.60% on Wednesday October 7, one basis point above the Tuesday. And the five-year Government of Canada benchmark closed at 3.60% on Thursday October 8, unchanged from the Wednesday, which closes the second of the two items this round-up had itself recorded as pending. So the newest close posted by the Saturday October 10 read was the 3.60% of Thursday October 8, nine basis points under the 3.69% the five-year Government of Canada benchmark closed at on Tuesday September 29, and three basis points under the 3.63% it closed at on Monday October 5. Across the four sessions of this window that had been posted by the Saturday October 10 read, the five-year Government of Canada benchmark traded in a four-basis-point range, between the 3.59% of Tuesday October 6 and the 3.63% of Monday October 5. The Friday October 9 close was not among them and the next entry on this page carries it. Why this is the number a Canadian borrower should watch rather than the Bank's policy rate: Canadian fixed mortgage rates are priced off Government of Canada bond yields, and only variable rates track the overnight rate, which has been 2.25% since the September 2 hold and cannot change before Wednesday October 28. On the Canadian rate ladder the advertised leader held a fifth consecutive reading, and on the fifth one nothing behind it moved either. Ratehub's comparison table for five-year fixed mortgages carried an update stamp of Saturday October 10, 2026 at 4:20 a.m. when it was re-read on the morning of that day, a fresh stamp rather than the Wednesday October 7 at 7:09 p.m. Eastern stamp the Thursday October 8 midday read had carried. Its lowest advertised five-year fixed rate was still 4.34%, and still shown once rather than twice: the entry listed as a Canadian Lender held it, while the generic Big 6 Bank entry that had matched it on the October 1, October 4 and October 7 readings stood at the 4.54% it had moved to by the Wednesday evening. Behind them Meridian Credit Union was unchanged at 4.59%, Alterna Savings unchanged at 4.69%, and Scotiabank unchanged at the 4.74% it had moved up to by the Wednesday morning, with RBC Royal Bank and National Bank of Canada at 4.84% and Equitable Bank, CMLS Financial and Canwise at 4.89%, then Bank of Montreal, First National and TD Bank at 4.99%. Every rung on that ladder was unchanged between the Thursday October 8 midday read and the Saturday October 10 morning one. So across five October readings the headline 4.34% did not move while both rungs this page has been watching behind it did: Scotiabank up fifteen basis points by the Wednesday morning and the cheapest big-bank quote up twenty by the Wednesday evening, after which the Friday and Saturday passed with the table still. The distance between the leader and the cheapest Big 6 quote widened from nothing to twenty basis points inside this window and stayed there. Prime was 4.45% on the Saturday read, the page itself attributing that to the rate hold, and it is unchanged since the September 2 hold. The 4.34% in the indicators strip above was re-confirmed on this read. The caution attached to that page in all three earlier October readings still held, and the Saturday October 10 read found every one of the five disagreements the Thursday October 8 read had enumerated, plus a sixth. A sentence refreshed to October 10, 2026 gave the lowest available high-ratio five-year fixed rate as 4.34%, agreeing with the dated comparison table, and gave the lowest available variable rate as 3.4%. A companion term-by-term table on the same page gave its five-year fixed row as 4.09%, and its four-year fixed row as 4.09% as well, with its one-year row at 4.59%, its two-year at 3.89% and its three-year at 3.94%, so that table had its four-year and five-year terms priced identically and both below its own one-year. A further passage gave the best five-year fixed rate as 4.09% against a best five-year variable of 3.30%, which disagrees with that same page's own 3.4% variable figure. And a frequently-asked-questions block was still anchored to a September 8, 2026 reading and still named Scotiabank as the cheapest of the big banks at 4.29%, a figure the dated table on the same page contradicted twice over on this read as well, since that table carried Scotiabank at 4.74% and the cheapest big-bank quote at 4.54%. The sixth disagreement is a fourth value for the same quantity: a passage elsewhere on the page said the lowest five-year fixed rate rose from 4.09% to about 4.24% in September, so the page offered 4.34%, 4.09% and about 4.24% for the lowest five-year fixed in three places at once. That same passage is the one piece of arithmetic on the page this desk can corroborate: it said the five-year Government of Canada bond yield jumped from 3.33% at the end of August to 3.69% in September and had stayed high, and 3.69% is exactly what the Bank of Canada posted for the session of Tuesday September 29. The dated comparison table is the part that is maintained. Read the stamp, and confirm any number with the lender before acting on it. One note on how that was read, because the first pass got it wrong in the direction that would have retired a true warning. An automated parse of the page aligned each rate cell against the wrong row label and reported the companion table's five-year row as 4.34%, in agreement with the dated table, which would have supported a correction saying the discrepancy had been fixed. It had not. The figures above are read off the page's own sentences rather than off that alignment, and the lesson is the one this page keeps relearning from the other side: check what the tool is asking before writing down what the source said. The finding of this window is about this publication's own schedule rather than about any release, and it is the same shape as the two American house-price publishers the previous entry wrote down. The Federal Reserve is one of the sources this page scans. The Federal Open Market Committee publishes minutes of each regularly scheduled meeting, and those minutes are a rates document: they are the fullest available account of how the committee read the economy at a decision, and they are the direct American counterpart of the Bank of Canada's Summary of Deliberations, which this page does schedule and did cover for the September 2 decision. The minutes were on no schedule this desk works from. No release day, no release hour, nothing, while the Canadian counterpart has both. The rule is published, and it was read off the Federal Reserve's own calendar page on Wednesday October 7: the minutes of regularly scheduled meetings are released three weeks after the date of the policy decision. The committee's September meeting ran over September 15 and 16 and its decision date was Wednesday September 16, so three weeks after it was Wednesday October 7. The hour is 2:00 p.m. Eastern, read off the Federal Reserve's own press release for the preceding set of minutes, which opens with the words for release at 2:00 p.m. EDT. That falls after the morning wake, which is why the Wednesday-morning pass of this entry carried no figure from the September minutes and no claim about what they say, and why the passages above were added on Thursday October 8 instead. What was checked rather than assumed: the minutes document for that meeting returned a 404 on the morning of Wednesday October 7, while the document for the preceding July 28 and 29 meeting returned a 200 at the identical URL shape in the same run. So the path was right and the 404 was a real absence rather than a broken pointer, which is the same positive control this page runs on the housing-starts slugs. The Federal Reserve's own 2026 calendar carried a statement, an implementation note, a press conference and projection materials against the September 15 and 16 row, and no minutes entry, which is what an unpublished set looks like on that page. Requested again at midday on Thursday October 8, that same URL returned a 200 and the document carried the October 07, 2026 stamp quoted above, so the three-week rule held to the day. It is written down here with its day and its hour so that the next set is scheduled rather than rediscovered. The committee's next decision date is Wednesday October 28, and three weeks after it falls on Wednesday November 18, which is when the next set of minutes is due at the same 2:00 p.m. Eastern hour. That handoff is the only thing that carries a release forward. A release nobody has recorded as pending has no carrier at all, and a source named in a scan list without a release day and hour gives a run no reason to look on any particular morning. Diffing Monday October 5 through Saturday October 10 against every source this page scans, in both directions. Statistics Canada published the seventeen releases enumerated above and none is a housing print, the September Labour Force Survey of Friday October 9 being the one this entry reads at length. The Canada Mortgage and Housing Corporation published no September housing starts: both slug shapes returned a 404 on Wednesday October 7, again on Thursday October 8 and again on Saturday October 10, while the August release returned a 200 at the same shape in the same run on all three days, so that absence is the corporation's and not a broken pointer here. On its cadence of on or about the sixteenth, the September release falls in the middle of this month. The Canadian Real Estate Association published nothing; its own national statistics page, read again on Saturday October 10, was still headed by its September 15 2026 release of August figures and still named Friday October 16, 2026 for the September package, which goes at 5 a.m. Eastern on the wire stamps of its last two releases, with a quarterly forecast following at 10 a.m. Eastern. The National Association of Realtors published nothing; its own statistical release schedule, read again on the Saturday, carried no October release before Tuesday October 13, when September Existing-Home Sales goes at the 10 a.m. Eastern that schedule states for all of its releases, and then nothing until Tuesday October 20 and Thursday October 29. Freddie Mac published the weekly survey folded in above and nothing since: the rate history file, re-read on Saturday October 10, still ended with the week ending October 8, which is correct on a Thursday-only cadence and is not an absence. The United States Census Bureau published two releases inside the window and neither is a housing statistic: U.S. International Trade in Goods and Services for August 2026, on Tuesday October 6 at 8:30 Eastern, and Monthly Wholesale Trade for August 2026, on Thursday October 8 at 10:00 Eastern. It published nothing on the Friday or the Saturday, and its own 2026 schedule carries no bureau release at all between Thursday October 8 and Wednesday October 14. The Federal Reserve held no meeting, its next being Tuesday October 27 and Wednesday October 28, published the September minutes read above, and then published the 2025 Survey of Consumer Finances on Friday October 9 at 10:00 a.m. Eastern, which has its own entry on this page. The Bank of Canada published one item dated inside this window, and the Thursday October 8 read of this entry could not see it. When its press-release index and its speeches index were both read at midday on Thursday October 8 the newest dated item on either was Thursday October 1, the Rogers remarks and the Bank's own summary of them, which are the separate October 1 entry on this page. Re-read on Saturday October 10, both indexes were headed by an item dated Thursday October 8, the explainer Demographic changes are reshaping the Canadian economy, which was therefore published after that midday read. It is a housing document as much as a demographic one and it has its own October 8 entry on this page. The lesson is the one this window keeps producing: a same-day read of an index records the hour it was taken rather than the day, and the only thing that recovers the remainder of the day is the next window going back over it. Read the other way, the gaps this window opened were the Federal Reserve's minutes, now scheduled and folded in, the Federal Reserve's Survey of Consumer Finances, which is cited on this page for the first time in this window and sits on no release calendar this desk keeps, and the two American house-price publishers the previous entry named. One of those two is now half closed and the next paragraph carries it. One note on the Census Bureau's calendar, because it will otherwise cost the next run a step. The undated economic-indicator calendar at the list-view path served the 2027 schedule when it was read on Wednesday October 7, and the 2026 schedule sits at a separate dated path. That is the same shape as the construction-spending document the previous entry wrote up, with the vintages the other way round: an undated path serves whatever the bureau treats as current, and what is current has rolled forward into next year's calendar rather than lagging behind in the previous month. The 2026 path is the one cited below, and read off it that morning: New Residential Construction for September on Tuesday October 20 at 8:30 Eastern, New Residential Sales for September on Tuesday October 27 at 10:00 Eastern, third-quarter Housing Vacancies and Homeownership on Wednesday October 28 at 10:00 Eastern, and September construction spending on Monday November 2 at 10:00 Eastern. The Federal Housing Finance Agency publishes its House Price Index release dates, and that retires half of a note three October entries have now carried. Both of the American house-price publishers this page cites were written down as publishing on a last-Tuesday convention rather than a published rule, with neither release hour verified. For the agency the dates are published: a table headed 2026 HPI Release Dates on its own House Price Index page, read on Saturday October 10, gives Tuesday October 27 for a monthly index covering data through August 2026, Tuesday November 24 for a quarterly index with monthly tables covering September 2026 and the third quarter, and Tuesday December 29 for a monthly index covering data through October 2026. So the three remaining 2026 dates are read rather than inferred, and all three do fall on the last Tuesday of their month, which is why the convention had looked like a rule. The release hour is still not stated on that table and this desk has not read it off the agency anywhere else, so it is not written down here: an unverified hour is the defect that writing any of this down is meant to prevent. The agency's monthly master file remains the machine-readable route to the series. The Case-Shiller indices are unchanged in status, and the reason is on the record: a request for that index family's page is refused to automated clients, so no figure from it should appear on this page that was not read. Ahead of the next entry, in date order, each hour as the source itself states it. Monday October 12 is Thanksgiving Day and a national holiday, so a benchmark close for that session is unlikely to be posted at all, in the way Wednesday September 30 never received one, and the Friday October 9 close that would ordinarily have been posted on it may be delayed with it. September Existing-Home Sales from the National Association of Realtors on Tuesday October 13 at 10 a.m. Eastern. Freddie Mac's next weekly mortgage survey on Thursday October 15 at 12:00 Eastern. The Canadian Real Estate Association's September resale package on Friday October 16 at 5 a.m. Eastern with its quarterly forecast at 10 a.m. Eastern, and the Canada Mortgage and Housing Corporation's September housing starts on or about the same date at 8:15 Eastern. The Bank of Canada's Business Outlook Survey and Canadian Survey of Consumer Expectations on Monday October 19 at 11:30 Eastern. New Residential Construction for September from the Census Bureau on Tuesday October 20 at 8:30 Eastern. The Federal Housing Finance Agency's monthly House Price Index on Tuesday October 27, now read off that agency's own published release-date table rather than inferred from a convention, with its release hour still unverified by this desk, and S&P Global's Case-Shiller indices on the same date on a last-Tuesday convention rather than a published rule, with that publisher's hour unverified as well. New Residential Sales for September on Tuesday October 27 at 10:00 Eastern and third-quarter Housing Vacancies and Homeownership on Wednesday October 28 at 10:00 Eastern. The Bank of Canada's interest rate announcement with a Monetary Policy Report on Wednesday October 28 at 09:45 Eastern. September construction spending on Monday November 2 at 10:00 Eastern. On Wednesday November 18 at 2:00 p.m. Eastern, the next set of Federal Open Market Committee minutes, covering the decision described one line above. And Statistics Canada's October Labour Force Survey on Friday November 6, 2026 at 08:30 Eastern, read off the September release's own next-release line. Decide on your own numbers rather than on the calendar. The Maple Syrup Money mortgage payment, affordability and stress-test, and rent-vs-buy calculators at maplesyrupmoney.com/tools/residential turn a 4.34% fixed or a 4.45% prime into a real monthly payment, and the commercial and investing calculators, cap rate, cash-on-cash, DSCR and the cash flow analyzer, at maplesyrupmoney.com/tools/commercial do the same for income property. Not financial advice. For educational purposes only.

Sources

Also reported

October 2026
Hands holding a residential mortgage loan application form across a desk

Finance

The Fed's Triennial Survey Finds Homeowners Richer and More Families Squeezed by…

The Federal Reserve Board released the results of the 2025 Survey of Consumer Finances on Friday October 9, 2026, for release at…

Read the full report

The Federal Reserve Board released the results of the 2025 Survey of Consumer Finances on Friday October 9, 2026, for release at 10:00 a.m. Eastern on the press release's own first line, together with its summary report Changes in U.S. Family Finances from 2022 to 2025. The survey has been run in its current form every three years since 1989, so this is the first full read of American family balance sheets since 2022, and the three years it covers are the three years in which American mortgage rates went from the bottom of their range to the top of it. It is the fullest available account of what American families own, how much they borrow and how they bank, and two of its findings are directly about housing. The homeownership rate was 66 percent in 2025, about unchanged from 2022. That is the headline nobody predicted correctly: three years of rising mortgage rates did not move the share of American families that own their home. What moved was the equity inside it. For families that owned a home, the median net housing value, which the Board defines as the value of the home minus home-secured debt such as a mortgage, rose to $230,000 in 2025 from $218,900 in 2022, an increase of $11,100 or 5.1%. So the typical American homeowning family came out of those three years with more equity than it went in with, and the barrier to becoming one of those families did not visibly rise in the ownership rate. The debt-service finding is the one that cuts the other way, and it is the sharpest number in the release. The fraction of families with debt payment-to-income ratios greater than 40 percent, which the Board describes as families with particularly high debt payment obligations relative to their incomes, increased from 6.5 percent to 8.6 percent. The Board states what that level means in context: it was last seen in the 2013 survey. So roughly one American family in twelve was spending more than 40 cents of every dollar of income on debt payments in 2025, a share last recorded when the country was still working through the aftermath of the housing crisis. The fraction of families carrying any type of debt at all was about stable at 77 percent, and median and mean debt outstanding were unchanged from 2022. Read those three together and the stress is not in how many families borrowed or in how much they owed. It is in what servicing it costs. The income and wealth figures around those housing numbers moved in opposite directions depending on where in the distribution you look, and the release says so plainly. Real median family income rose 7 percent between the 2022 and 2025 surveys to $82,200, while real mean family income fell 6 percent to $145,200. Families in the lower ends of the income and net worth distributions saw modest increases in median and mean income, and families in the upper ends saw declines. Real median net worth rose by 2 percent to $215,900 and real mean net worth rose by 7 percent to $1.24 million, with most families across the net worth and income distributions experiencing increases in median and mean wealth. Note the shape of the median family's balance sheet: net worth of $215,900 against median net housing value of $230,000 for the families that own, which is to say the house is the balance sheet for a very large number of American households rather than one asset on it. Two more findings for completeness, neither of them housing. Retirement plan participation, counting account-type plans, individual retirement accounts and defined benefit plans, was up slightly at around 65 percent, and for families with account-type plans both mean and median balances rose. Participation in the stock market, counting direct and indirect holdings, declined slightly from 58 percent in 2022 to 56 percent in 2025, while median holdings among families that held stock grew 36 percent from $56,900 to $77,400. Why this is on a page a Canadian reader uses. The comparison is not the rate, it is the structure. An American family in this survey is typically carrying a thirty-year fixed mortgage, which does not renew, so a family that bought before rates rose kept its payment and a family that has not bought faces the full 7.40% thirty-year average the weekly Freddie Mac survey printed for the week ending October 8. A Canadian family on a five-year term renews into whatever rate exists at renewal, which is why the 4.34% five-year fixed at the top of the broker table on Saturday October 10 is not the bargain against 7.40% that the arithmetic suggests. The two countries distribute the same interest-rate risk to different people: in the United States it falls almost entirely on buyers who have not bought yet, and in Canada it falls on every owner in turn as each term ends. The 8.6 percent debt-service figure above is what that risk looks like once it has arrived, and it is the number to watch for a Canadian equivalent through the next two years of renewals. The survey is conducted for the Board by NORC at the University of Chicago, with participants chosen at random from 119 geographic areas including metropolitan areas and rural counties, using sampling procedures intended to produce a sample representative of American families. On its three-year cadence the next full survey covers 2028 and would be published in 2029, and this desk has recorded no published release date for it. The survey appears on no release calendar this page keeps, which is noted here rather than left to be rediscovered: the Federal Reserve is a source this page scans, and two of its publications now have a schedule written down, the Federal Open Market Committee's minutes at three weeks after each decision date and the statement itself at 2:00 p.m. Eastern on each decision day, while this one does not. Decide on your own numbers rather than on the calendar. The Maple Syrup Money mortgage payment, affordability and stress-test, and rent-vs-buy calculators at maplesyrupmoney.com/tools/residential turn a 4.34% fixed or a 4.45% prime into a real monthly payment, and the commercial and investing calculators, cap rate, cash-on-cash, DSCR and the cash flow analyzer, at maplesyrupmoney.com/tools/commercial do the same for income property. Not financial advice. For educational purposes only.

A desk calculator resting on a printed financial report with bar and pie charts

Newcomer

Fewer Newcomers Will Cool Housing Demand, and the Labour Force Is Already…

Two institutions described the same shift one day apart, from opposite ends of it.

Read the full report

Two institutions described the same shift one day apart, from opposite ends of it. On Thursday October 8 the Bank of Canada published an explainer titled Demographic changes are reshaping the Canadian economy, the third in a series on structural change that already includes technology and international trade. On Friday October 9 Statistics Canada published the September Labour Force Survey, and the largest single thing in it was not the month's job losses but a text box on population aging. The Bank's piece is about what fewer newcomers will do to housing demand. The survey is about what an older population has already done to the labour force. Read together they are one story, and it is the story that matters most to anyone who has arrived in Canada recently or is deciding whether to. What the Bank published. Canada's population grew every single year for more than 150 years, and in 2025 that growth slowed to 0.5%, which the Bank describes as the slowest rate in more than a century. It gives two reasons. The birth rate has been below the replacement level for more than 50 years, so the population is aging. And immigration has begun to decline after a significant increase in the early 2020s, when population growth reached as much as 3% a year against a steady rate of about 1.2% over most of the previous 50 years. The Bank notes that the early-2020s increase raised the number of workers and helped ease labour shortages, and that it also increased pressure on housing and social services. It dates the turn to 2024, when the federal government began to reduce immigration levels. The housing passage is the reason this belongs on this page, and the Bank states the mechanism rather than only the direction. Businesses can often adjust production relatively quickly by hiring or increasing output, but the housing sector responds more slowly than other parts of the economy: it takes time to build a house or an apartment building, so stronger demand pushes up rents and house prices instead. Run that in reverse and you get the Bank's forecast. Fewer immigrants are expected to arrive in the coming years, which will reduce demand for housing, and that could lower pressure on housing costs. The Bank attaches a cost to the same sentence: less immigration also means fewer workers and weaker demand for other goods and services, so the economy will not grow as fast. A newcomer reading that is being told the thing that makes housing cheaper is the same thing that makes the job market thinner. Aging changes housing demand as well as labour supply, and in a different direction. The Bank puts Canada's median age at about 26 in 1971 and over 40 today, and says the trend is largely driven by the baby boom generation now reaching retirement age. Its housing observation is specific: older people have different housing needs, and many choose to move to smaller homes that are easier to maintain. That is a composition change in what gets demanded rather than a reduction in it, and it sits alongside more spending on health care and more on leisure. On the supply side, as more people retire there will be fewer young people replacing them, a smaller workforce produces less, and labour shortages could push up wages in some sectors, which could feed prices and inflation. The Bank is explicit about the limits of its own role here, and the sentence is worth quoting because it is the opposite of a policy promise. It does not have a role in making immigration policy and it cannot change the fact that Canadians are getting older. What it says it needs is to understand how structural changes of this kind affect the economy and inflation, now and in the future, in order to keep inflation at or around its 2% target. The series carries the same framing: the Bank cannot offset the effects of these changes, and what it can do is keep inflation low, stable and predictable while the economy adjusts. What the survey measured. Statistics Canada put the labour force participation rate at 64.8% in September 2026, down 0.2 percentage points on the month, and recorded that as the lowest level since December 1997, when it was also 64.8%, excluding 2020 during the pandemic. Year over year it was down 0.4 percentage points, and the agency attributes that largely to population aging. The arithmetic behind the attribution is published with it. People aged 65 and older were 23.2% of the working-age population in September 2026, up from 20.5% in September 2019 before the pandemic, against 14.8% at the turn of the millennium. Holding the September 2019 age composition constant, the agency calculates that the participation rate in September 2026 would have been little changed year over year, down 0.1 percentage points, and would have been 0.2 percentage points higher than in September 2019. The agency also notes that the upward trend in the 65-and-older share paused briefly in 2023 and 2024, when sharp increases in permanent and temporary immigration offset the aging of the population, and resumed in 2025 and into 2026. That pause is the point where the two documents touch. The same immigration surge the Bank says raised the number of workers and pushed up housing costs is the thing Statistics Canada says held the 65-and-older share of the working-age population flat for two years. Both institutions are now describing its withdrawal. Neither claims the result for housing is simple: the Bank says reduced demand could lower pressure on housing costs and in the same paragraph says the economy will grow more slowly, and a slower economy is not a friendly place to qualify for a mortgage. Nothing here is a forecast of a price, and no figure in either document is one. One number to keep from the same survey, because it is the one a lender looks at. Average hourly wages among employees rose 2.3% year over year in September, up $0.86 to $37.64, following growth of 2.0% in August, not seasonally adjusted. Set that against the five-year fixed mortgage rate on the broker table, which was 4.34% on Saturday October 10, and against the American thirty-year fixed average, which was 7.40% for the week ending October 8. Wage growth of 2.3% does not close a gap of that size on its own, which is why the demographic argument above is about the next several years and not about this renewal. The next Labour Force Survey is on Friday November 6, 2026, and October data will reflect labour market conditions during the week of October 11 to 17, both read off the September release's own next-release line. Decide on your own numbers rather than on the calendar. The Maple Syrup Money mortgage payment, affordability and stress-test, and rent-vs-buy calculators at maplesyrupmoney.com/tools/residential turn a 4.34% fixed or a 4.45% prime into a real monthly payment, and the commercial and investing calculators, cap rate, cash-on-cash, DSCR and the cash flow analyzer, at maplesyrupmoney.com/tools/commercial do the same for income property. Not financial advice. For educational purposes only.

A real estate agent handing house keys to a smiling couple outside their new home

United States

A Quarter-Point Week Takes the American Thirty-Year to Its Highest Since 2023

Rate Watch, week of September 28, continued: the ISO week that opened on Monday September 28 runs through Sunday October 4, so…

Read the full report

Rate Watch, week of September 28, continued: the ISO week that opened on Monday September 28 runs through Sunday October 4, so this entry carries the same week as the September 30 entry and is separated from it only because the month turned on a Thursday. This entry now closes that week. It was opened on Thursday October 1 and extended on Sunday October 4 to cover Friday October 2, Saturday October 3 and Sunday October 4, which is the last day of the ISO week; the next entry opens a fresh round-up for the week beginning Monday October 5. Nothing a Canadian borrower could see had moved when this entry was opened at the morning wake, and every release on the day's own calendar still fell ahead of it then. Two of them have since landed and are carried below: the Census Bureau's August construction spending at mid-morning, and Freddie Mac's weekly mortgage survey at midday, which was the largest single weekly move of this run. Both are American. A Canadian figure moved as well, later and more quietly: the Bank of Canada's five-year benchmark close for Thursday October 1 was posted after this entry was first written, and it is carried in the window section at the foot of this entry. Thursday October 1 brought four Statistics Canada releases, lettered a through d, and e returned a 404. They were: Canadian postsecondary enrolments and graduates for 2024/2025, a data availability announcement for the Survey on Health Care Access and Experiences covering virtual care and pharmaceuticals in 2025, the Machinery and Equipment Price Index for July 2026, and the Integrated Criminal Court Survey for 2024/2025. None of the four is a housing, mortgage or rates release. That is a genuinely quiet morning from the agency rather than a morning this desk failed to read, and keeping those two apart is the whole reason the letters get enumerated instead of sampled. Freddie Mac's Primary Mortgage Market Survey printed at 12:00 Eastern and it was the largest weekly move of this run. The thirty-year fixed average for the week ending October 1 came in at 7.28%, up 25 basis points from the 7.03% of the week ending September 24, and the fifteen-year fixed at 6.60%, up 18 basis points from 6.42%. That is a sixth consecutive weekly increase on the thirty-year, counting from the 6.65% of the week ending August 20, and the steps in that run were one basis point, then five, then five, then nineteen, then eight, and then twenty-five — so the climb has not merely continued, it has arrived at its largest single week. Both averages were the highest the survey had printed since the week ending November 22, 2023, when the thirty-year stood at 7.29% and the fifteen-year at 6.67%. The thirty-year's lowest weekly average of 2026 was 5.98%, for the week ending February 26, which leaves 130 basis points between the cheapest and the dearest weekly average this calendar year. What that costs an American borrower is the part worth holding on to. On a $400,000 thirty-year fixed mortgage, 7.28% is a principal-and-interest payment of about $2,737 a month, against about $2,669 at the 7.03% of the week before and about $2,568 at the 6.65% of the week ending August 20 that this run started from — so six weekly prints took roughly $169 a month, a little over $2,000 a year, out of the same household's budget for the same house. Nothing about the house changed. For a Canadian reader the useful comparison is a term apart and should not be read as like-for-like: the lowest advertised five-year fixed rate on the Canadian comparison table read on the morning of Thursday October 1 was 4.34%, which was 294 basis points under the American thirty-year average, but a five-year Canadian term and a thirty-year American one are different products carrying different renewal risk, and the gap between them is not a measure of which borrower is better off over the life of the loan. The Census Bureau's August construction spending had come earlier the same day, at 10:00 Eastern, as release CB26-158, and the residential line is the one that matters here. Total construction spending ran at a seasonally adjusted annual rate of $2,203.1 billion, 0.9% above the revised July figure of $2,184.5 billion and 1.7% below the $2,242.0 billion of August 2025. Private residential construction was $882.3 billion, 1.1% above July's revised $872.7 billion and 4.8% below the $926.9 billion of August 2025. Read that monthly rise carefully, because the bureau does the reader the service of saying so itself: it attaches a confidence interval of plus or minus 1.3 percentage points to the 1.1% and marks it as including zero, which means there is not enough evidence to conclude the August residential figure differed from July's at all. The annual decline of 4.8% carries no such mark. And the new-building lines inside that total barely moved — new single-family at $403.3 billion was 0.2% above July and 3.5% below a year earlier, new multifamily at $115.8 billion was 0.2% above July and 0.6% below a year earlier — so whatever lifted the residential total on the month, it was not houses going up. The September report is scheduled for Monday November 2, read off this release's own closing line. One correction to the morning's own reasoning, because it is the kind that will recur. That reading concluded from the undated construction-spending document that a dated document is to be preferred to an undated one. For this particular release the opposite holds, and it was checked: the dated shape for August, pr202608.pdf, returned a 404 on the afternoon of October 1, because the bureau's archive of dated releases only reaches the previous month and still ended at July. So the undated path is the only one that carries the newest release, and it is a trap only in the narrow sense that it serves the previous month until the new one prints. Read the release date off the first line of whatever it serves — this one opens by naming 10:00 Eastern on October 1 — rather than trusting the path to tell you which month you have. A second finding of the day is about this publication's own scan list rather than about any one release, and before those two American prints landed it was the whole of this entry. Two American house-price publishers that this corpus already cites were on no schedule this desk works from, with no release day and no release time recorded for either: the Federal Housing Finance Agency and S&P Global's CoreLogic Case-Shiller indices. Both ordinarily publish on the last Tuesday of the month, which was Tuesday September 29 and therefore inside this week. A source named nowhere in a schedule is a source nothing makes a run check, so it gets covered in the months somebody happens to think of it. Both were checked on Thursday October 1, and both are written down here so that the next run inherits them rather than rediscovering them. The Federal Housing Finance Agency's monthly purchase-only house price index was read that morning from the agency's own master file. Its newest reference month was July 2026, at 443.52 seasonally adjusted against June's 442.34, a rise of 0.27% on the month, and at 451.60 unadjusted against 440.33 in July 2025, a rise of 2.6% over the year. On the newest month that agency had published, American house prices were still rising, and the seasonally adjusted series had risen in each of the three monthly readings before it as well. The vintage is the point rather than the level, and it is the part a reader is most likely to get wrong. July 2026 sits two months before the move this publication has been tracking on the American side: Freddie Mac's thirty-year fixed average printed 6.76% for the week ending September 10, 7.03% for the week ending September 24 and 7.28% for the week ending October 1, and the July reference month precedes all three. So the newest available read on American house prices cannot yet show what a thirty-year above 7% does to them, and anyone setting the two series side by side is comparing a July outcome against an October price of credit. Keep the vintages apart. S&P Global's Case-Shiller pages could not be read, and the shape of the refusal is worth recording because it is not the shape a reachability check reports. A GET on the index-family page returned HTTP 403 with an Akamai access-denied body, from two different automated clients on Thursday October 1, while a HEAD on the identical URL returned 200. A 403 to an automated client is an access control rather than a missing document, and that publisher serves a browser normally, so this entry makes no claim about what Case-Shiller printed, carries no figure from it and leaves it open. The part worth keeping is that a check which asks HEAD first and accepts a 2xx will score such a URL as fine while every GET against it is refused, which is the inverse of the asymmetry those checks are built for. The agency's release time was not obtained from the publisher either, so it is not recorded here as verified; it needs a day and an hour read off the source before any run treats it as scheduled. On the Canadian side one rung of the ladder moved and the top of it did not. Ratehub's comparison table for five-year fixed mortgages, read on the morning of Thursday October 1, carried a September 30, 2026, 5:19 p.m. update stamp. Its lowest advertised five-year fixed rate was 4.34%, shown twice, once against a Big 6 bank and once against an entry listed as a Canadian Lender, with 4.49% from Meridian Credit Union and 4.59% from Scotiabank behind it. The 4.44% rung from Alterna Savings that stood on the Monday September 28 read was no longer on the table, so the third-best advertised rate moved from 4.44% to 4.49% while the best one did not move at all. Prime was 4.45%, unchanged since the September 2 hold, and it cannot change before the Bank's announcement on Wednesday October 28. The warning the previous entry attached to this page still applies, in a second form: a companion table higher up the same page listed 4.09% as the lowest five-year fixed rate while the dated comparison table beneath it carried 4.34%, and the written commentary around them was still anchored to a September 8, 2026 reading. The dated table is the part that is maintained. Read the stamp, and confirm any number with the lender before acting on it. The Bank of Canada's five-year benchmark series was reached on Thursday October 1, which closed out the three September sessions two earlier entries had been unable to read; those three figures are carried in the September 30 entry rather than repeated here. When the series was first read at 08:58 Eastern that morning its latest posted session was Monday September 28; a re-read eight minutes later carried Tuesday September 29 as well, and that close is carried in the September 30 entry with the other three rather than repeated here. Wednesday September 30 was a Bank holiday, and no close was ever posted for it. The Bank ordinarily posts the prior session's close the following morning, and the holiday interrupted that rhythm rather than breaking it. The series was read a third time at 12:20 Eastern, at the midday wake that folded in the two American releases above, and the newest session it carried was still the Tuesday September 29 close; nothing had been posted for Wednesday September 30, which was the holiday, and nothing for Thursday October 1. At the hours named on Thursday October 1, therefore, this entry carried no October benchmark figure and asserted nothing about that series beyond what those readings showed. That gap is closed in the window section at the foot of this entry, which carries the Thursday October 1 close as it was posted afterwards. All three of the items that stood ahead of this entry at the morning wake have now been picked up, and how the first two looked beforehand is worth keeping. Freddie Mac's rate history file, read at that wake, still ended with the week ending September 24 at a 7.03% thirty-year fixed and a 6.42% fifteen-year fixed; the week ending October 1 appeared in the same file after the midday print and is carried above. The Census Bureau's undated release document was still serving the July report, release number CB26-140 of September 1, when it was checked that morning — which is what an unpublished release looks like on that path. The dated August release, CB26-158, is the one carried above. The third item is the Bank of Canada's and it was still ahead at the hour this entry was first written on Thursday October 1. Senior Deputy Governor Carolyn Rogers spoke that afternoon to the Greater Victoria Chamber of Commerce and CFA Society Victoria, in Victoria. The morning read of the Bank's upcoming-events page gave neither a time nor a subject, which is why this entry would not characterise the speech. Both are in fact published, on the Bank's speeches index rather than on that event page: the subject is given there as Canada's housing market, and the remarks are listed for approximately 15:20 Eastern. So the earlier caution against assuming the speech touches housing was wrong on the facts, and it is corrected here rather than left standing — this is a speech about Canadian housing by the Bank's second-ranking official, just under four weeks before the Bank's October 28 announcement, and it was the most directly relevant thing the Bank had said about housing ahead of that date, which nothing it published between Friday October 2 and Sunday October 4 displaced. It fell after the hour at which this entry was first written, so nothing in this paragraph is an account of what was said. That account was written on Sunday October 4 and is the separate October 1 entry on this page. One correction belongs here rather than there: the event page cited from this paragraph was still serving its upcoming-events placeholder when it was re-read on the morning of Sunday October 4, three days after delivery, and the remarks had been published on a sibling page under the speech's own title. The citation below now points at the remarks. The transferable part is smaller than the speech and more useful: a release can be fully published and still absent from the one surface a run happens to check, so when a page says a detail is unavailable, look for a sibling page on the same site before writing the absence down. One release fell on Friday October 2 and it was not a housing print. The United States Bureau of Labor Statistics published the Employment Situation for the September reference month at 08:30 Eastern that morning, and what it said is carried in the window section at the foot of this entry. That release date and hour were read off the bureau's own schedule of releases rather than inferred, and the inference they replace should be retired: the previous entry recorded this date as following a first-Friday rule because that bureau's page had declined an automated request, and the schedule itself breaks that rule several times in the same year, putting the January 2026 reference month on February 11 and the April 2026 month on May 8. The page was readable on Thursday October 1 and the refusal recorded three days earlier turned out to be a property of the client used, not of the bureau: one HTTP client was given a 403 and a second was given a 200 within the same hour. Statistics Canada's September Labour Force Survey comes a week after that, on Friday October 9, read off the next-release line of that survey's own August edition, so the two North American labour prints do not share a morning this month. The Canadian one is the vintage the unemployment figure in the indicators strip above is keyed to. Diffing Thursday October 1 against every source this publication scans, in both directions, as it stood that day; the same diff for Friday October 2 through Sunday October 4 is in the window section at the foot of this entry. Statistics Canada published the four releases enumerated above and none is a housing print. The Canada Mortgage and Housing Corporation published no September housing starts; both slug shapes returned a 404 that morning, and on that corporation's cadence of on or about the sixteenth the September release is due in the middle of this month. The Canadian Real Estate Association published nothing, and its own page states Friday October 16, 2026 for the September package, which goes at 5 a.m. Eastern on the wire stamps of its last two releases, with a quarterly forecast following at 10 a.m. Eastern on forecast months. The National Association of Realtors published nothing; its next is September Existing-Home Sales on Tuesday October 13 at 10 a.m. Eastern. Freddie Mac published its weekly survey at midday and its figures are carried above. The Census Bureau published August construction spending at mid-morning, also carried above; its next housing releases are New Residential Construction for September on Tuesday October 20 at 8:30 Eastern, New Residential Sales for September on Tuesday October 27 at 10:00 Eastern and third-quarter Housing Vacancies and Homeownership on Wednesday October 28 at 10:00 Eastern. The Federal Reserve held no meeting; its next is October 27 and 28. The Bank of Canada's next interest rate announcement, with a Monetary Policy Report, is Wednesday October 28 at 09:45 Eastern, and its Business Outlook Survey and Canadian Survey of Consumer Expectations are released on Monday October 19 at 11:30 Eastern, both read off the Bank's own upcoming-events page that morning; the Bank's only item dated Thursday October 1 is the Rogers speech described above, which fell after the hour this entry was first written. Read the other way, the two publishers named earlier in this entry are the gap: cited in this corpus, scheduled nowhere in it. Friday October 2 through Sunday October 4, read on the morning of Sunday October 4, is the rest of this ISO week, and it had one business day in it. The United States Bureau of Labor Statistics published the Employment Situation for September at 08:30 Eastern on Friday October 2, as release USDL-26-1549, and the headline reading was a labour market that barely moved. Nonfarm payroll employment changed little at plus 29,000, against an average monthly gain of 45,000 over the prior twelve months, and the unemployment rate changed little at 4.2%, with 7.1 million people unemployed. That rate "has remained in a narrow range of 4.1 percent to 4.3 percent since March," in the bureau's own words. The labour force participation rate was 61.8% and the employment-population ratio 59.2%, both of which the bureau describes as showing little net change since January. The number of long-term unemployed, meaning jobless for 27 weeks or more, was essentially unchanged at 1.9 million, which was 27.1% of all unemployed people. Average hourly earnings for all employees on private nonfarm payrolls edged up five cents, or 0.1%, to $37.81, and were 3.0% higher over twelve months. The revisions are the part the headline hides, and they point the other way. The change in total nonfarm payroll employment for July was revised down by 31,000, from plus 21,000 to minus 10,000, and the change for August was revised down by 29,000, from plus 162,000 to plus 133,000. Taken together, employment in July and August was 60,000 lower than previously reported, and July turned negative on revision. So a reader who takes "changed little" at face value gets a steadier picture than the full release supports: the month itself was flat, and the two months before it were weaker than anyone had been told at the time. Two lines inside that release touch housing directly, and neither of them is a housing statistic. Construction employment changed little at plus 11,000 in September, against an average of 10,000 jobs a month over the prior twelve months, with nonresidential specialty trade contractors continuing to trend up at plus 12,000. So the building trades were still adding jobs at about their ordinary pace even with the thirty-year fixed average at the highest level that survey had printed since 2023. Financial activities employment was little changed at minus 7,000 and is down by 129,000 since a recent peak in May 2025, most of that loss in insurance carriers and related activities. Why an American jobs print belongs in a mortgage entry at all is worth stating plainly rather than overstating. American fixed mortgage rates are priced off long-term Treasury yields, and the labour market is one of the main inputs markets read when they price those yields. That is the same mechanism, one country over, as Canadian fixed rates being priced off Government of Canada bond yields rather than off the Bank of Canada's overnight rate, and it is the reason a jobs number can move a mortgage rate without any central bank doing anything. That is the link, and it is also where this entry stops: no Treasury yield was read for Friday October 2, so nothing here asserts that this print moved one. The next weekly mortgage survey, on Thursday October 8 at 12:00 Eastern, is the first place such a move would show up in a figure this publication tracks. The Employment Situation for October 2026 is scheduled for Friday November 6 at 08:30 Eastern, read off this release's own closing line. The Bank of Canada's five-year benchmark series was read again on the morning of Sunday October 4, and it had moved on from where this entry first left it. The five-year Government of Canada benchmark closed at 3.62% on Thursday October 1, seven basis points under the 3.69% of Tuesday September 29, and that was the newest session the series carried when it was read. It also settles the holiday question this entry had left open on Thursday October 1: there is no September 30 observation in the series at all, so it runs straight from the Tuesday September 29 close to the Thursday October 1 close, and the Bank holiday never received one. No session had been posted for Friday October 2 when the series was read on the morning of Sunday October 4; on the Bank's ordinary next-morning rhythm that session would be posted on Monday October 5, and this entry asserts nothing about what it will carry. Statistics Canada published three releases on Friday October 2, lettered a through c, with d returning a 404: motor vehicle fuel sales for 2025, the Commercial and Industrial Machinery and Equipment Rental and Leasing Services Price Index, and Canadian foreign post indexes for October 2026. None of the three is a housing, mortgage or rates release. Saturday October 3 and Sunday October 4 each returned a 404 at the first letter, which is a weekend rather than a morning this desk failed to read. That is the same distinction the Thursday October 1 enumeration above draws, and it is the reason the letters get walked rather than sampled. The Canadian rate ladder moved one rung inside the window, and not at the top of it. Ratehub's comparison table for five-year fixed mortgages carried a Friday October 2, 8:58 p.m. update stamp when it was read on the morning of Sunday October 4. Its lowest advertised five-year fixed rate was 4.34%, shown twice as it had been on the Thursday October 1 read, once against a Big 6 bank and once against an entry listed as a Canadian Lender. Behind them Meridian Credit Union had moved from 4.49% to 4.59%, Scotiabank stayed at 4.59%, and Alterna Savings was back on the table at 4.69%. So the best advertised rate did not move across the window while the third rung moved up by ten basis points, which is the second week running that this entry has recorded movement behind an unmoved leader. Prime was 4.45%, unchanged since the September 2 hold, and it cannot change before the Bank's announcement on Wednesday October 28. The caution attached to this page twice already still stood on the Sunday October 4 read: a companion table higher up the same page continued to show 4.09% as the lowest five-year fixed rate against the dated table's 4.34%, with its written commentary still anchored to a September 8, 2026 reading. The dated table is the part that is maintained. Read the stamp, and confirm any number with the lender before acting on it. Diffing Friday October 2 through Sunday October 4 against every source this publication scans, in both directions. Statistics Canada published the three releases enumerated above on Friday October 2 and nothing across the weekend, and none of them is a housing print. The United States Bureau of Labor Statistics published the September Employment Situation, carried above. Freddie Mac published no new weekly survey: its rate history file still ended with the week ending October 1 at a 7.28% thirty-year fixed and a 6.60% fifteen-year fixed when it was read on the morning of Sunday October 4, and the next print is Thursday October 8 at 12:00 Eastern. The Canada Mortgage and Housing Corporation published no September housing starts; both slug shapes returned a 404 again, and on that corporation's cadence of on or about the sixteenth the September release falls in the middle of this month. The Canadian Real Estate Association published nothing; its own national statistics page was still reporting August figures and still names Friday October 16, 2026 for the September package. The National Association of Realtors published nothing, and its press-release index carried no item dated inside the window; its next is September Existing-Home Sales on Tuesday October 13 at 10 a.m. Eastern. The Census Bureau published nothing new, and the construction-spending document it serves is still the August release carried above, whose own closing line names Monday November 2 for the September report. The Federal Reserve held no meeting and published no statement inside the window; its next meeting is October 27 and 28. The Bank of Canada published nothing dated inside the window either: the newest item on both its press-release and speeches indexes was still Thursday October 1, the Rogers remarks and the Bank's own summary of them, which are the separate entry on this page. Read the other way, the two American house-price publishers named earlier in this entry are still the gap, cited in this corpus and scheduled nowhere in it, and they still carry no release day and no release time this desk can point to. That did not change inside the window, and nothing here claims they were re-checked in it. One forward item off the Bank's own calendar, because it will matter to whichever entry next reads the benchmark series. Monday October 12 is Thanksgiving Day and a national holiday, so a benchmark close for that session is unlikely to be posted at all, in the way Wednesday September 30 never received one. The Bank's Business Outlook Survey and Canadian Survey of Consumer Expectations follow on Monday October 19 at 11:30 Eastern. Decide on your own numbers rather than on the calendar. The Maple Syrup Money mortgage payment, affordability and stress-test, and rent-vs-buy calculators at maplesyrupmoney.com/tools/residential turn a 4.34% fixed or a 4.45% prime into a real monthly payment, and the commercial and investing calculators, cap rate, cash-on-cash, DSCR and the cash flow analyzer, at maplesyrupmoney.com/tools/commercial do the same for income property. Not financial advice. For educational purposes only.

Sources

In brief

1 more from October 2026
Policy The Bank of Canada's Senior Deputy Governor Calls Housing Affordability a Trap Oct 1

Senior Deputy Governor Carolyn Rogers gave the Bank of Canada's fullest statement on housing this year in Victoria, British Columbia, on the afternoon of Thursday October 1, speaking to the Greater Victoria Chamber of Commerce and CFA Society Victoria. The remarks are titled Canada's housing affordability dilemma, and the dilemma is the whole argument: both directions of the housing market hurt, which is why the problem has survived fifteen years of policy she helped write. Higher prices, in her words, "make housing less affordable and leave many households with less room for everything else," while lower prices "weigh on consumer confidence, wealth and economic growth." Her own word for that is a trap. She said plainly that the speech would not deliver a solution, that if there were an easy one "the problem would be fixed by now," and that she would not assign blame, because the levers "are spread across different levels of government and many different agencies and regulators." She is explicit about both refusals, which is unusual enough in a central banker's speech to be worth noting before anything else in it is quoted. Three figures carry the structural argument and they are the part of it a reader is least likely to find elsewhere. First, Canadian banks are heavily exposed to residential mortgages: "About half of all bank lending is tied to residential real estate," which is what ties the health of the banking system to the price of houses. Second, the economy's mix has inverted. In 2000 residential investment accounted for 4.3% of gross domestic product while overall business investment in machinery, equipment and innovation accounted for 8.3%; today that relationship is reversed, so that, as she put it, "housing sits at the heart of our productivity challenge too." Third, on the scale of the move all of this follows: in Canada the average house price rose about 50% in two years through the pandemic period, while mortgage credit surged as households borrowed at very low rates. The passage most directly useful to a Canadian borrower is the one about the stress test, because Rogers is the official who introduced it. She was at the Office of the Superintendent of Financial Institutions when the mortgage underwriting guidelines for banks were strengthened in the fall of 2017, and the biggest change "required borrowers to demonstrate that they still had room to make their mortgage payments at a higher interest rate than their contracted rate." Its practical effect, she said, was to reduce the maximum amount of mortgage debt borrowers could access, and the criticism was loudest from the mortgage broker and real estate industries. What she wants understood about it is the purpose: "It was not a forecast that interest rates would rise, and it was not an attempt to slow the rise in house prices. It was a way to make sure borrowers had a margin of safety against a range of risks: higher interest rates, a loss of income or unexpected expenses." Her verdict on it has two halves and both matter. "The experience since then has proven the value of the stress test. It did what it was designed to do" — it strengthened mortgage underwriting, gave borrowers a buffer and "helped protect financial stability through a period of sharply higher interest rates." And: "the stress test did very little to make housing more affordable as prices continued to climb." A rule that protects the borrower is not a rule that cheapens the house, and those are the two things people most often expect a single policy to do at once. On the Bank's own job she took two questions from this year's review of the monetary policy framework, which the Bank runs every five years. The first was whether monetary policy should do more to lean against rapidly rising house prices. Her answer is that interest rates plainly matter for house prices but cannot be aimed at them: a rate increase takes some pressure off prices by reducing demand while making it harder for new buyers to qualify and raising payments for some existing borrowers, and a rate cut improves access to credit while risking higher prices wherever supply is constrained. "We set one interest rate for the whole economy. We cannot set one rate for housing and another for everything else." Interest rates also, she notes, "can't build homes, rezone land or speed up permits." The second question was whether the consumer price index measures shelter in a way that reflects what affordability actually feels like. Here she named the effect that confuses most readers of an inflation print: because mortgage interest costs sit inside the index, raising rates to bring inflation down temporarily adds to the measured number, so "the tool we use to reduce inflation can, for a time, add to the inflation number itself." The review looked at alternatives used in other countries, including measures that weight house prices more heavily and measures that use rental values as a proxy for owner-occupied housing, and concluded that each carried its own problems and none would do a clearly better job. Her conclusion is that regulation "can make markets fairer, strengthen borrowers and banks and help the financial system absorb shocks. But it can't restore affordability," which will take "more supply, better planning and infrastructure, regulation that protects resilience, and incentives that don't add demand to a market already short on supply." For the Bank itself, "the best contribution is still price stability," and targeting house prices directly with interest rates "would ask monetary policy to do more than it can reasonably do." Read against the calendar that is a deliberately modest brief from the second-ranking official at the institution whose next interest rate announcement, with a Monetary Policy Report, is Wednesday October 28 at 09:45 Eastern, just under four weeks after the speech. Nothing in the remarks is a signal about that decision and none of it should be read as one. One finding about where the remarks live, because it cost this desk a step. The Bank's event page for this speech was still serving its upcoming-events placeholder when it was read on the morning of Sunday October 4, three days after delivery, carrying the body text "Remarks will be published on the Bank's website" and a content type of Upcoming events. The remarks were in fact published, on a sibling page of the speeches index under the speech's own title, and so was a separate Bank-written speech summary of them. A page that answers HTTP 200 with the wrong document is invisible to any check that only asks whether a URL resolves, so the citations below point at the remarks and the summary themselves rather than at the event listing, which is where the previous entry on this page had pointed. Repair the pointer rather than the sentence it supports: the claim was true when written and the Bank published the document somewhere else. Decide on your own numbers rather than on the speech. The Maple Syrup Money mortgage payment, affordability and stress-test, and rent-vs-buy calculators at maplesyrupmoney.com/tools/residential turn a rate and a price into a real monthly payment and show what a higher qualifying rate does to the most you can borrow, which is the mechanism Rogers describes from the regulator's side. The commercial and investing calculators, cap rate, cash-on-cash, DSCR and the cash flow analyzer, at maplesyrupmoney.com/tools/commercial do the same for income property. Not financial advice. For educational purposes only.

Earlier coverage — 298 reports from October 2025 through September 2026